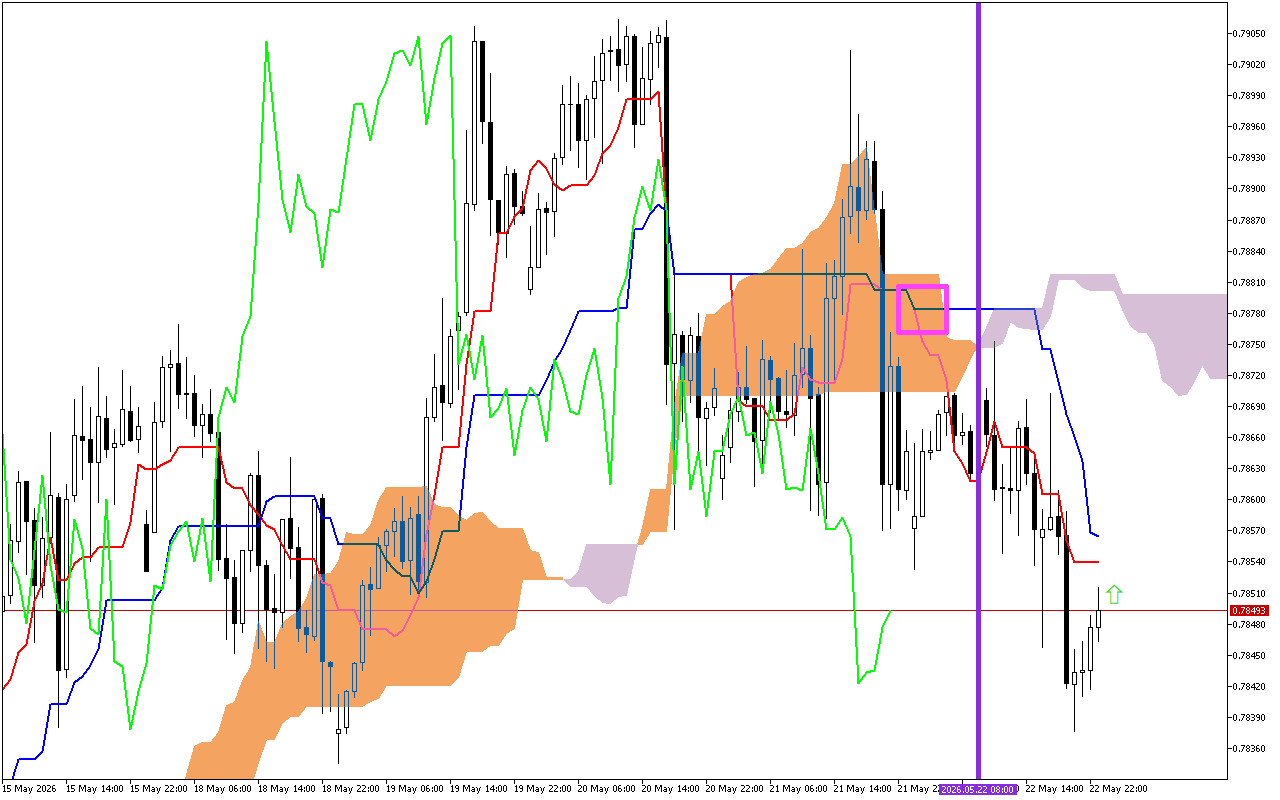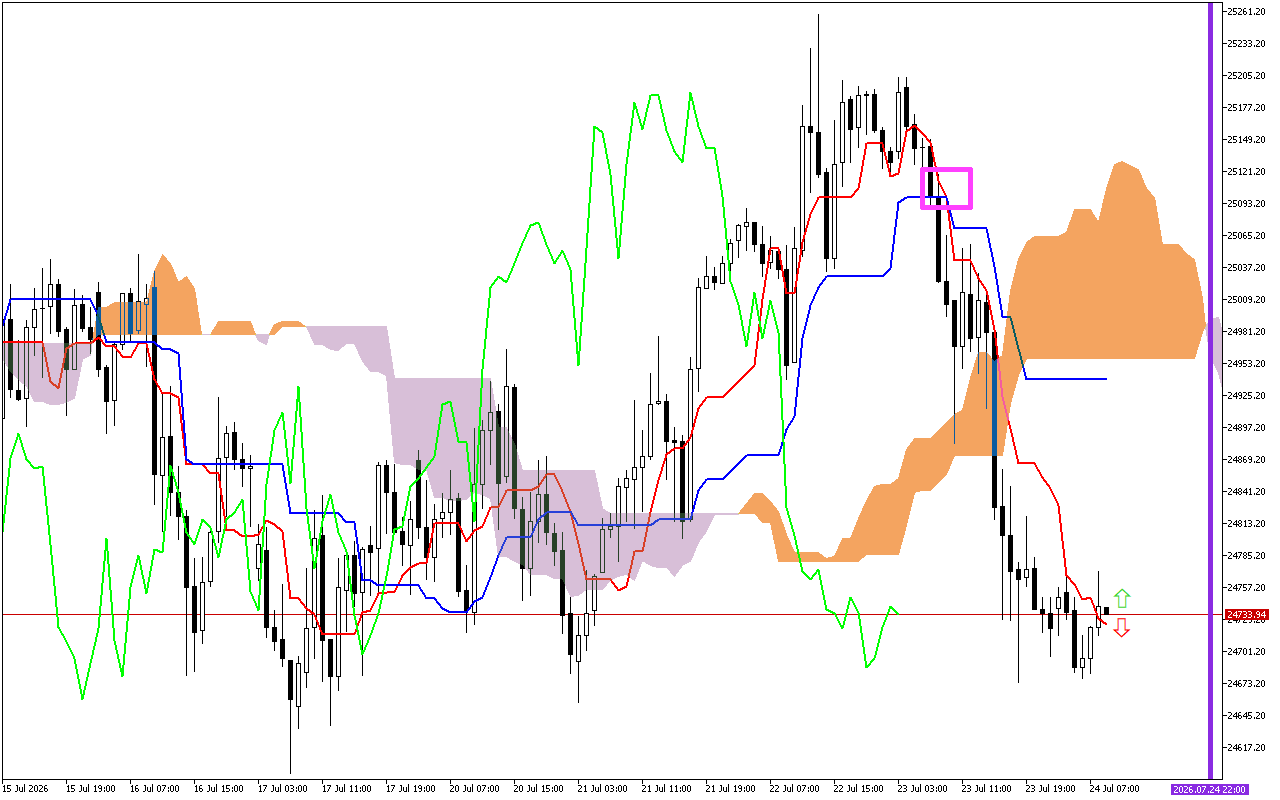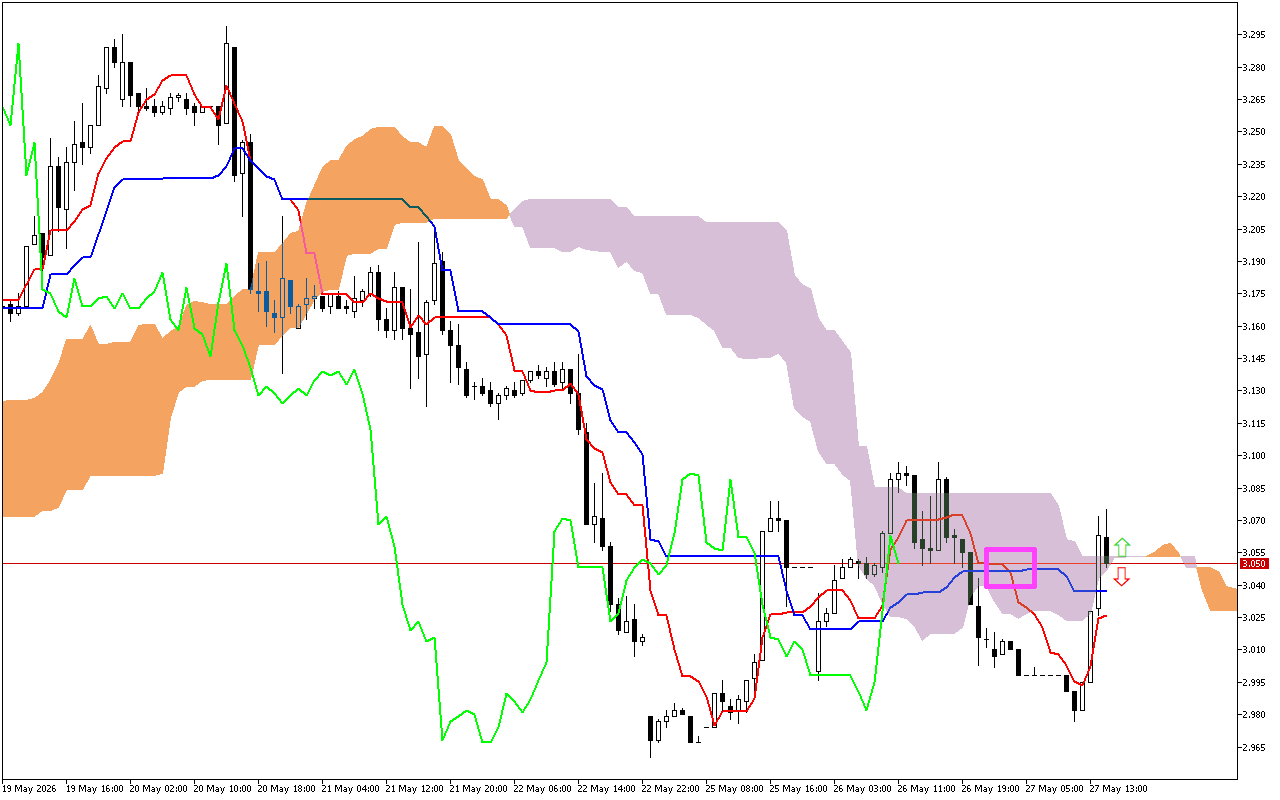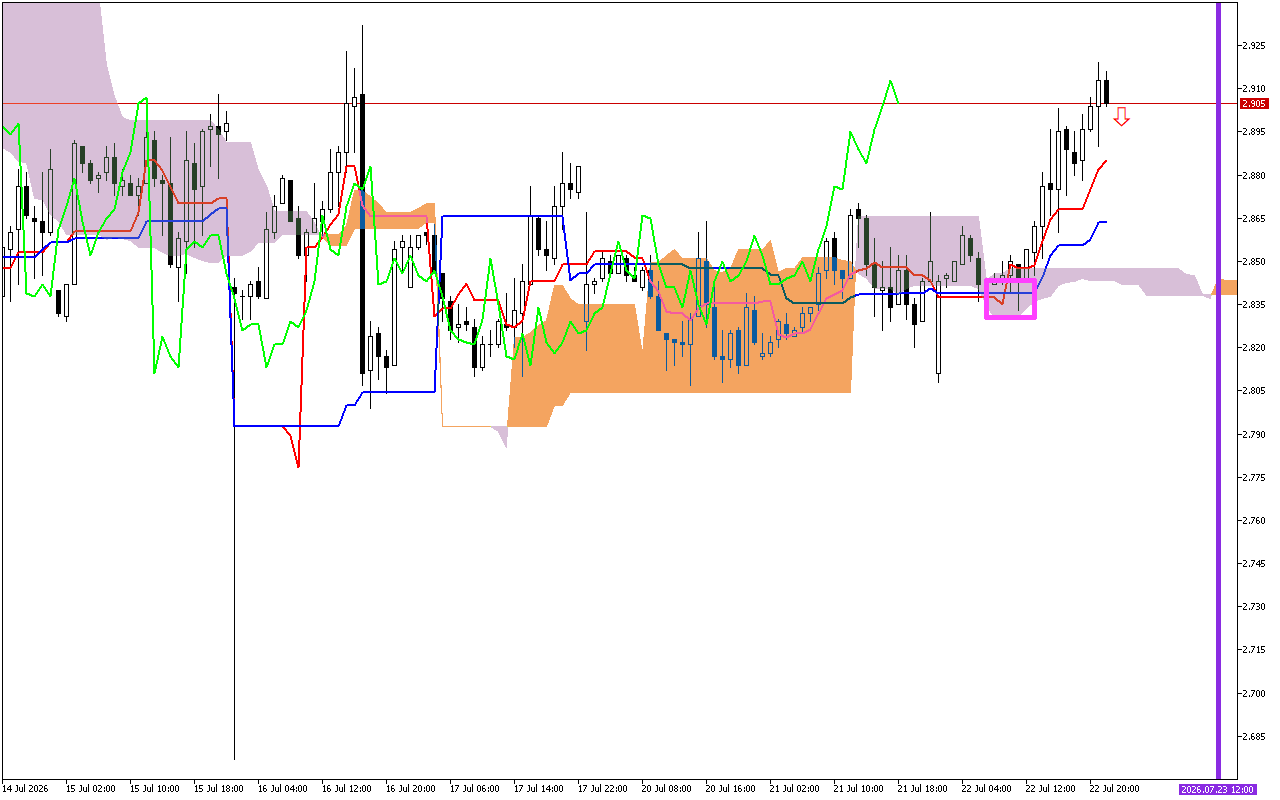
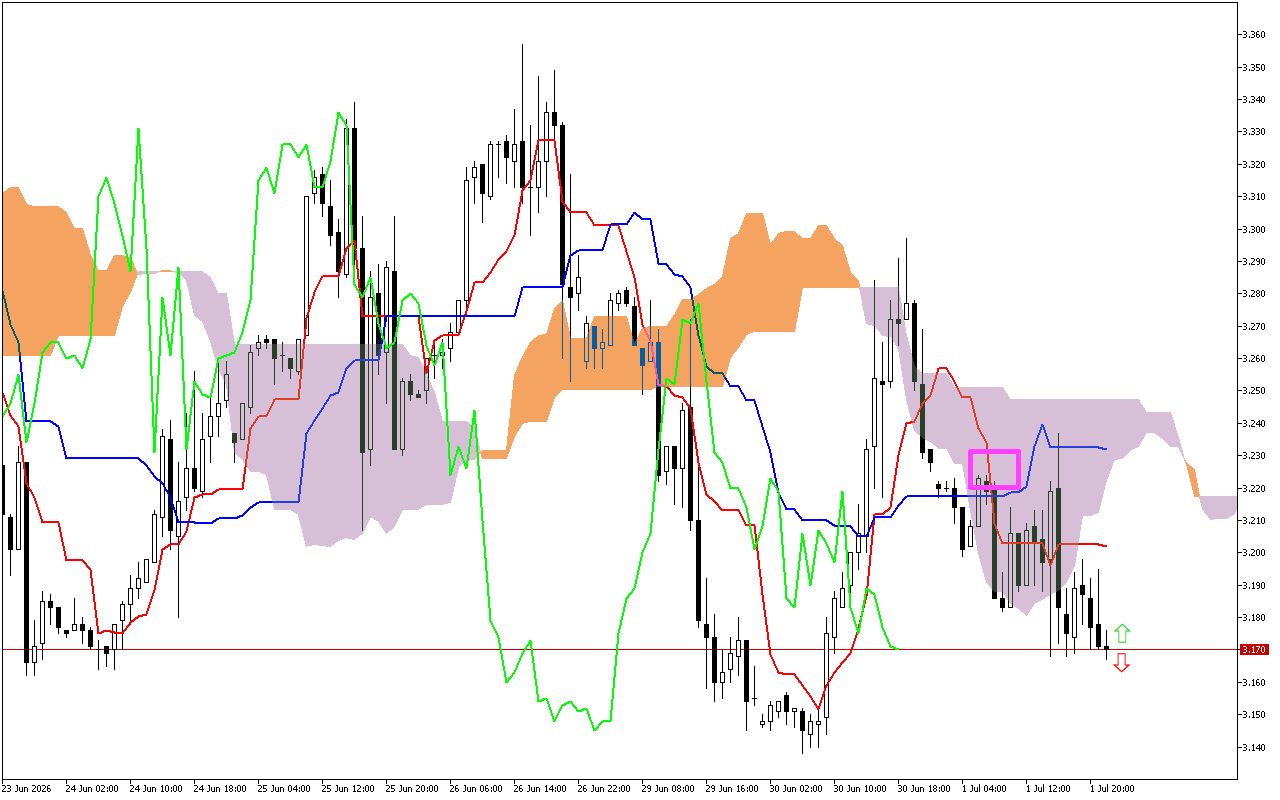
The main signal of the latest trading sessions is the intersection of the Tenkan and Kijun lines, marked on the chart with a pink square. This is a negative signal. It indicates a change in the upcoming trend to a downward one.
The current situation
Let’s look at the main components of the indicator and their current values:
The price is below the Tenkan and Kijun lines, indicating the prevalence of downward pressure.
The Kumo cloud lines are on the same level, indicating the market uncertainty.
The price is below the Kumo cloud, which is now acting as a resistance area for the price.
The Chikou line is now below the current price.
Trading recommendations:
Dynamic resistance levels are located at the Tenkan line near level 3.203, the Kijun line around level 3.232, the SenkouA line near level 3.212, and the SenkouB line around level 3.248.
Intraday, these levels can be used to search for the potential entry points into the market.