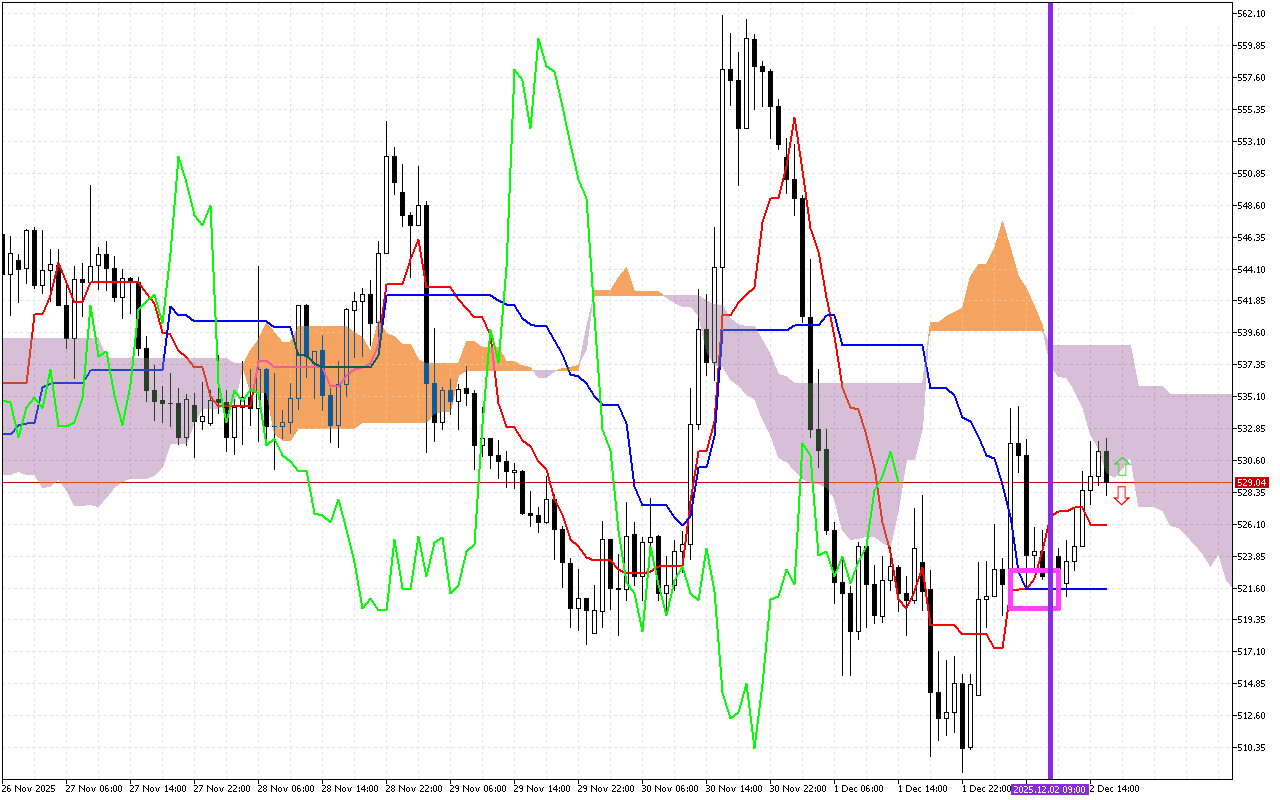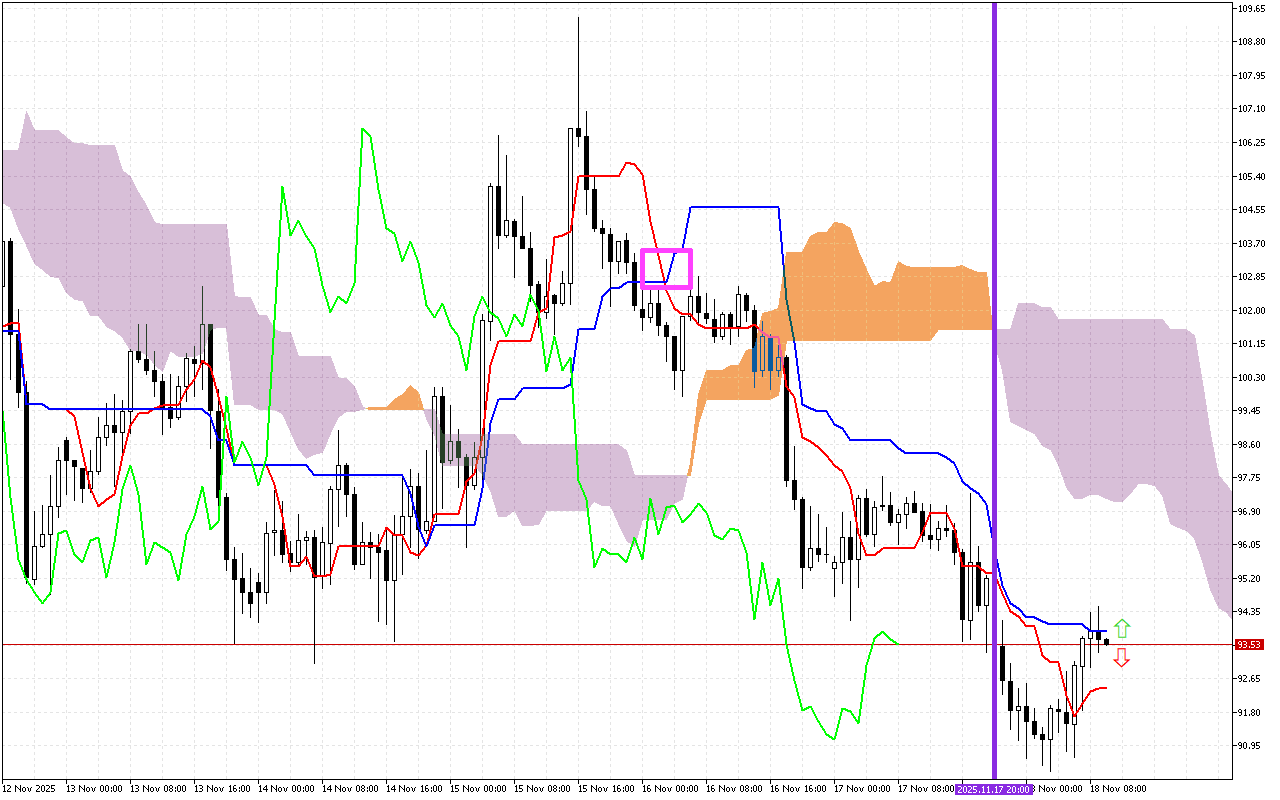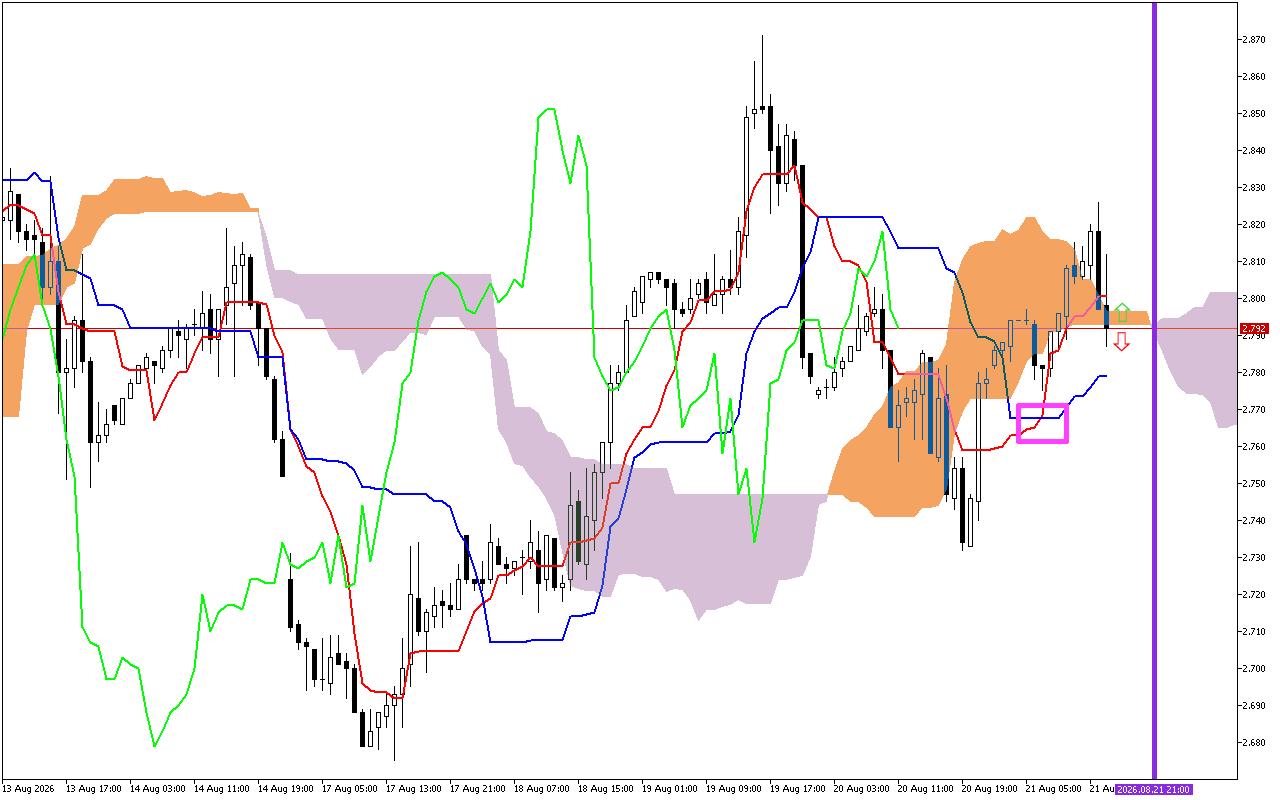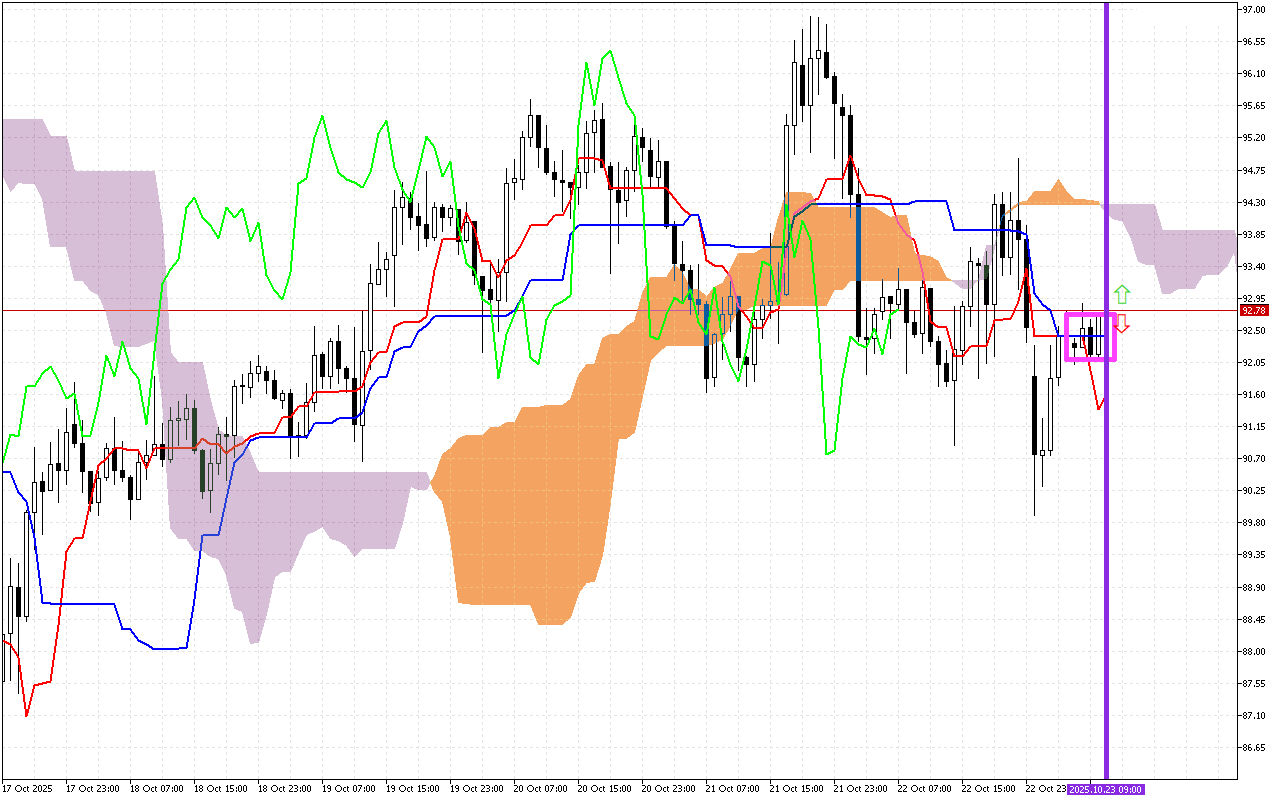
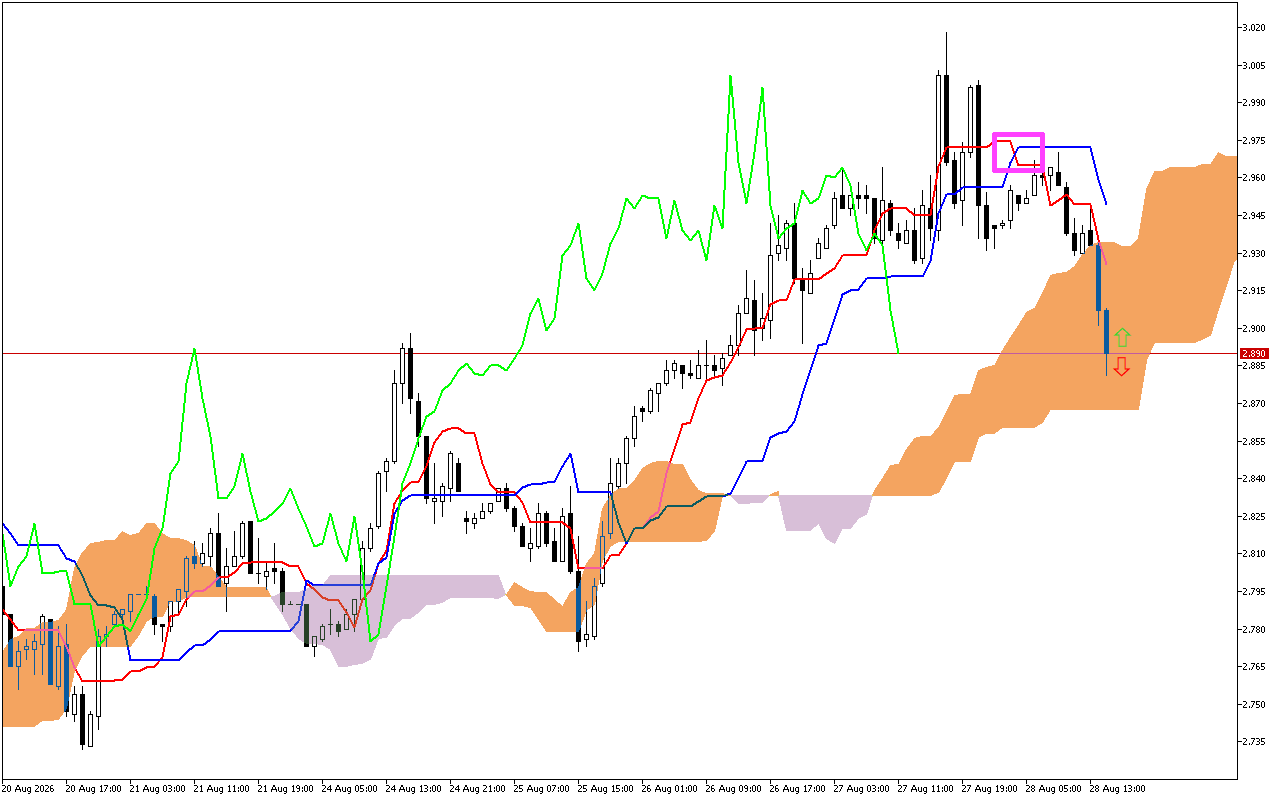
During previous trading sessions, the intersection of the Tenkan and Kijun lines, marked with a pink square, was observed on the Natural Gas chart. This signal indicates a potential change in the downward trend.
The current situation
Let’s carefully look at the current values of the main components of the Ichimoku indicator to assess the current state of the market:
The Tenkan and the Kijun lines are positioned above the current price. It indicates a negative market sentiment in the moment.
The Kumo cloud has narrowed as much as possible, indicating a change in direction or consolidation.
The price is between the SenkouA and SenkouB lines, which act as support and resistance levels. To clarify the market situation, it is worth waiting until the price goes beyond the Kumo cloud.
Used by investors to identify a change in trend, the green Chikou line is held below the price on the chart.
Trading recommendations:
The dynamic support level is on the SenkouB line, around the 2.867 mark.
Dynamic resistance levels are on the Tenkan line, around the 2.935, the Kijun line, around the 2.959, and the SenkouA line, around 2.934.
Intraday it is worth prioritizing the signals to enter the market near the defined support and resistance levels.