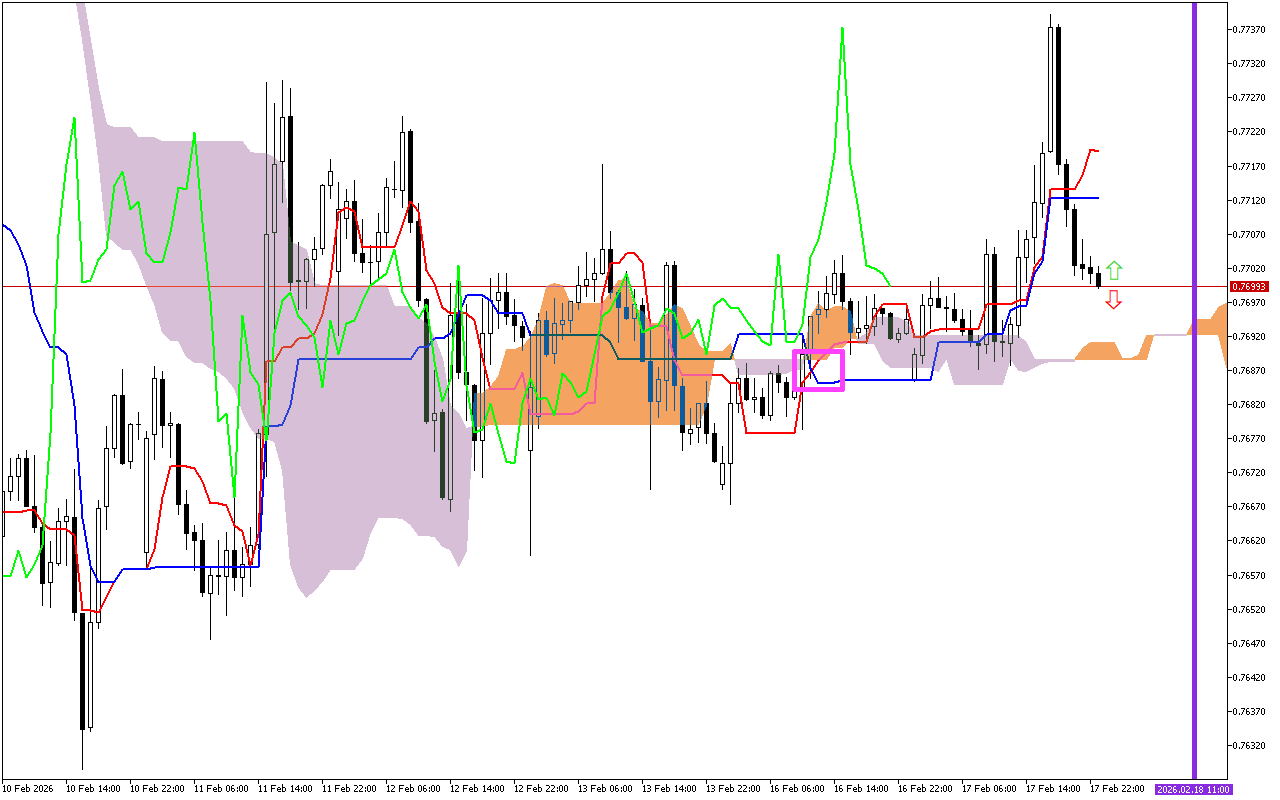
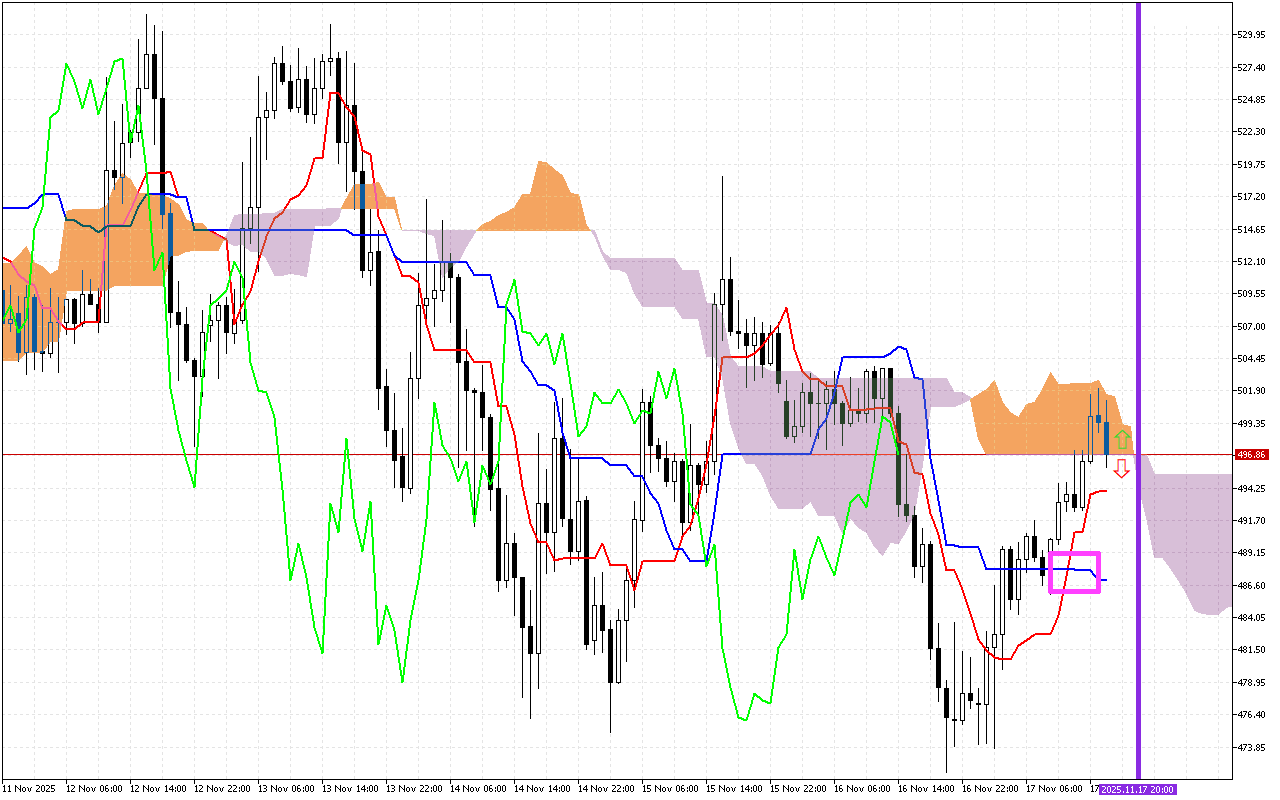
One of the main signals of previous trading sessions was the intersection of the Tenkan and Kijun lines. This area is marked with a pink square on the graph. The rise of the Tenkan line above the Kijun line is a positive signal, which may indicate a possible change in the trend to an upward one.
The second most important signal is the change in direction of the Kumo cloud, marked with a vertical purple line. A change in the color of the cloud to lilac indicates a transition of the priority direction of movement to downward.
The current situation
Let’s look at the main components of the indicator and their current values:
The price is above the Tenkan and the Kijun lines. It indicates positive market sentiment.
The Kumo cloud is colored lilac. It indicates the priority of the downward vector of price movement.
The price is inside the Kumo cloud, which indicates a market uncertainty phase. The SenkouA and SenkouB lines act as support and resistance.
Used by investors to identify a change in trend, the green Chikou line is above the price on the chart.
Trading recommendations:
Dynamic support levels are located on the Tenkan line, around the 493.99, the Kijun line, around the 486.96, and the SenkouB line, around the 496.91.
The dynamic resistance level is on the SenkouA line, around the 502.70 mark.