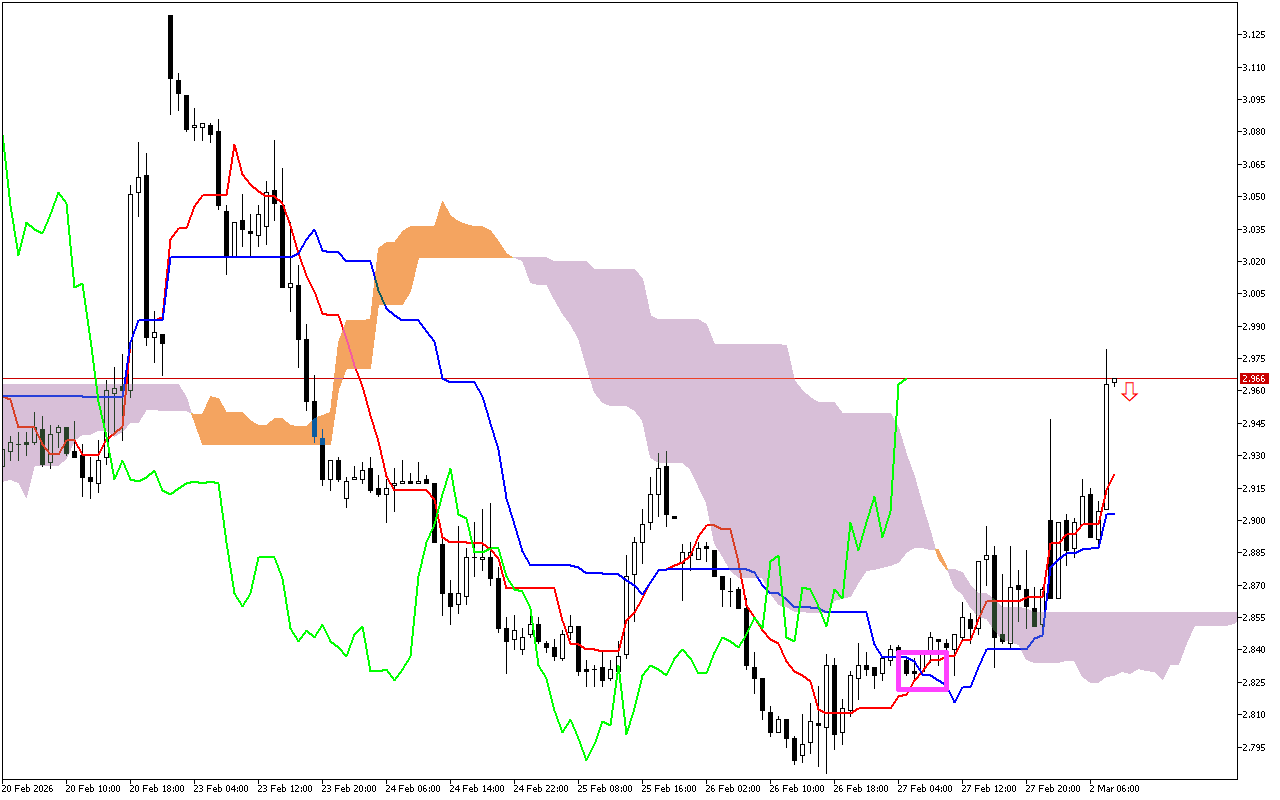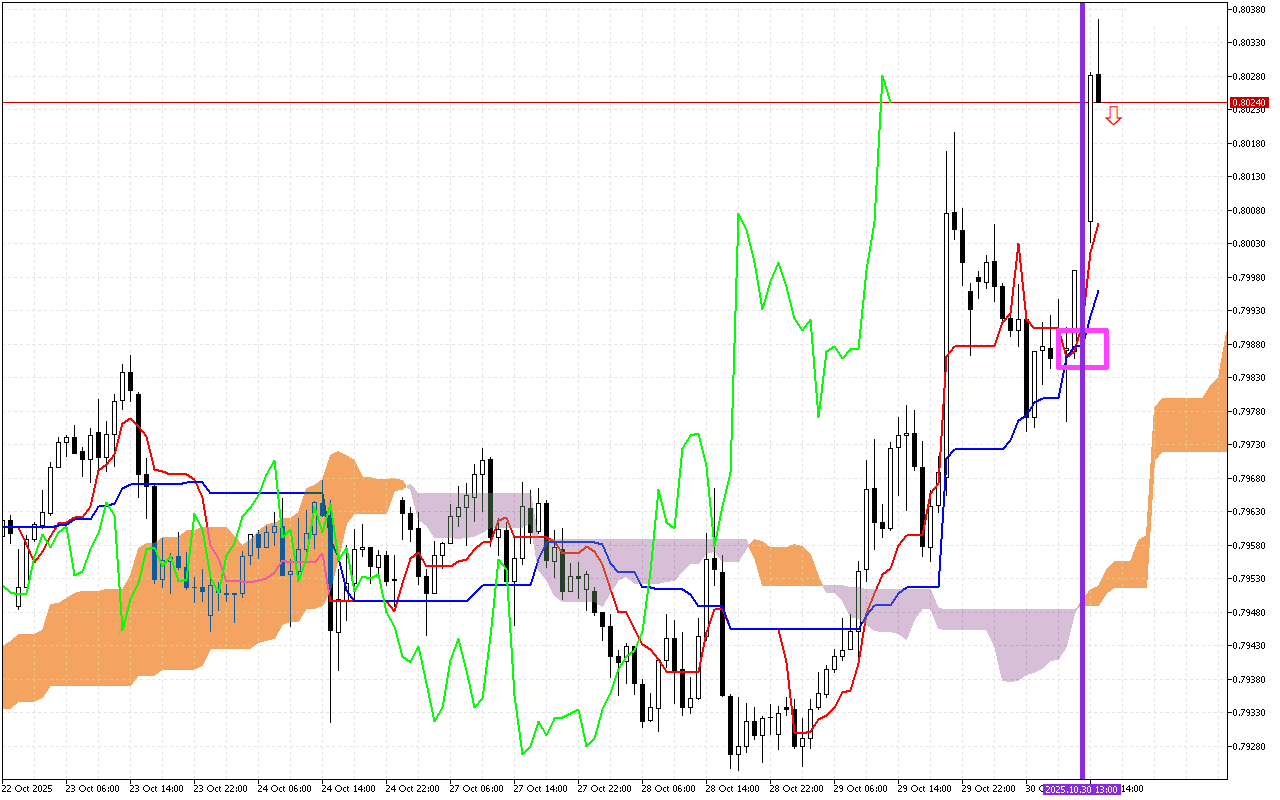
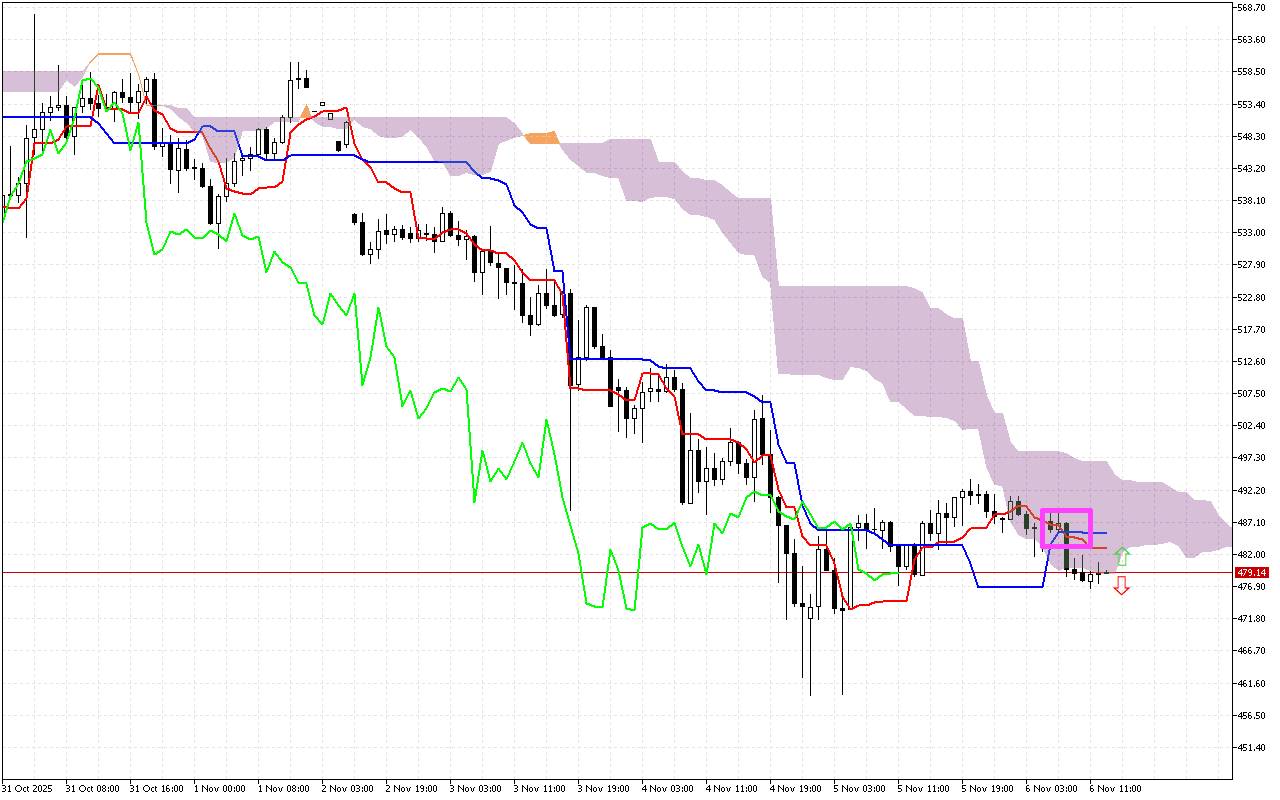
The main signal of the latest trading sessions is the intersection of the Tenkan and Kijun lines, marked on the chart with a pink square. This is a negative signal. It indicates a change in the upcoming trend to a downward one.
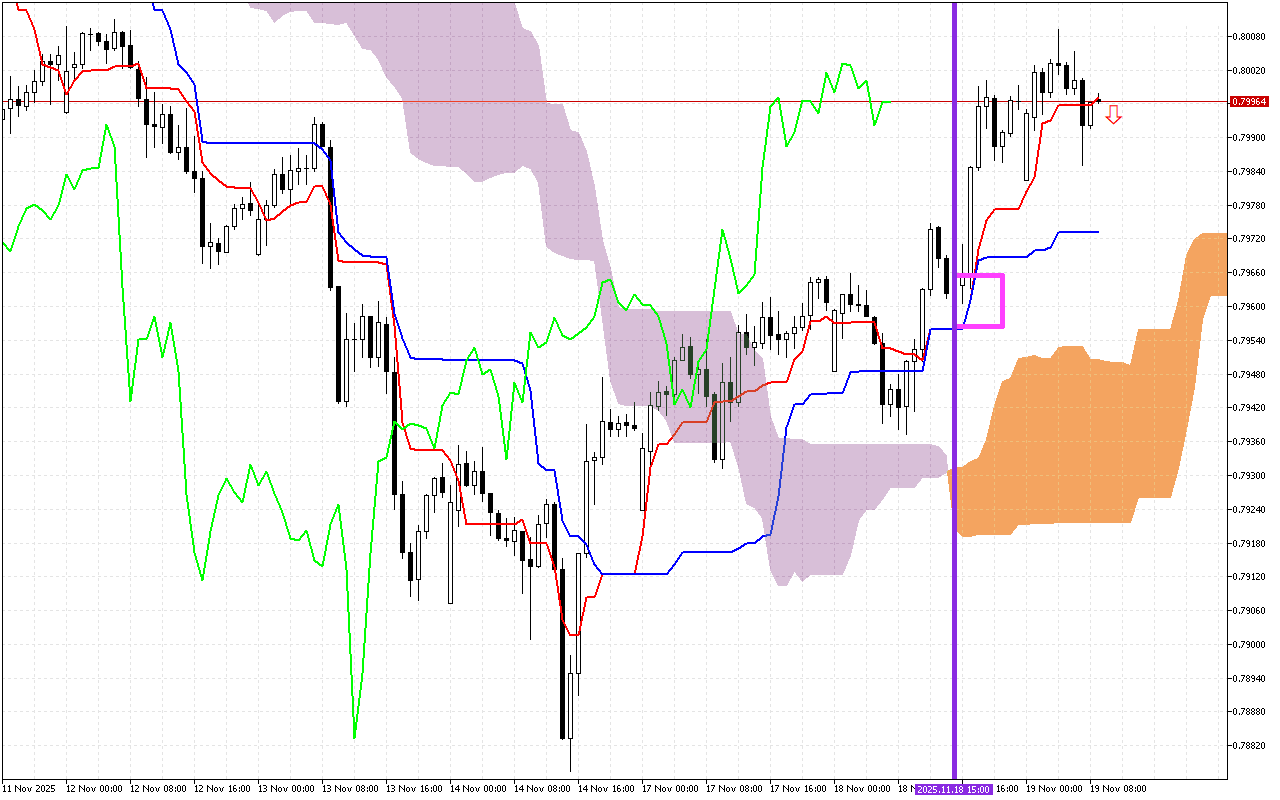
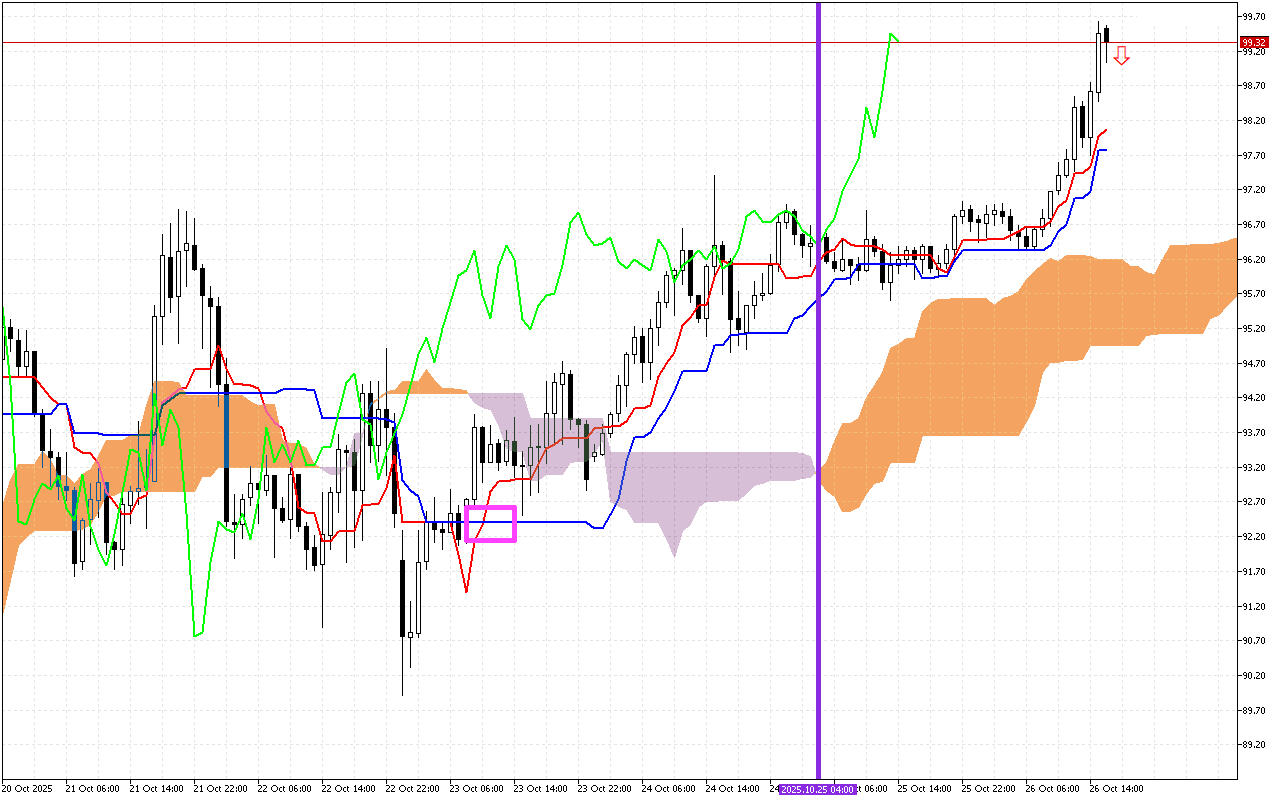
The second most important signal is a change in the direction of movement of the cloud Kumo. This signal is marked on the chart with a vertical purple line. The orange color of the cloud indicates a change in the priority direction of movement to upward.
The current situation
Let’s look at the main components of the indicator and their current values:
The price is below the Tenkan and Kijun lines, indicating the prevalence of downward pressure.
The Kumo cloud is colored orange, indicating the market tendency to a continuing upward movement.
The price entered the Kumo cloud, which may indicate a possible trend change or a development a lateral drift phase. The SenkouA and SenkouB lines act as support and resistance. To clarify the market situation, it is worth waiting until the price fixes outside of the cloud.
The Chikou line is now below the current price.
Trading recommendations:
The dynamic support level is on the SenkouA line, around the 478.90 mark.
Dynamic resistance levels are located on the Tenkan line, near the 482.92, the Kijun line, near the 485.27, and the SenkouB line, near 496.79.