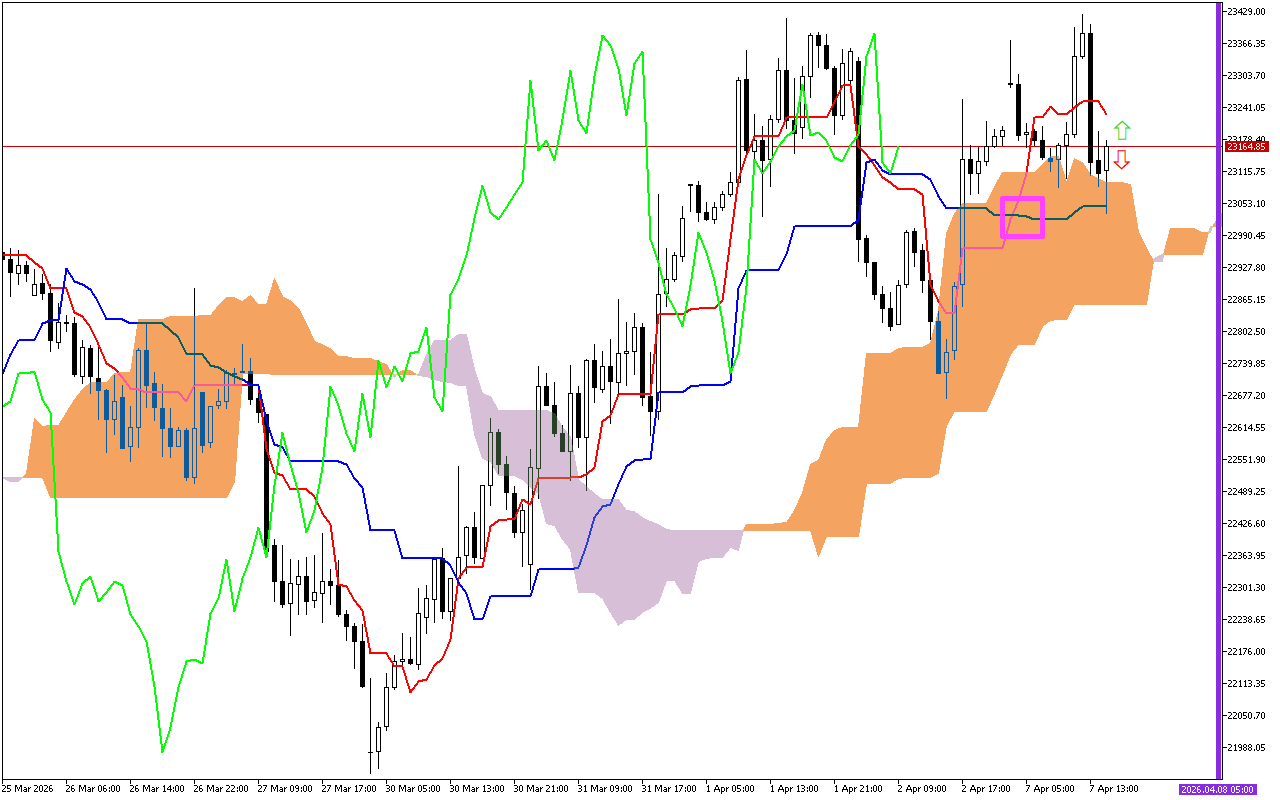
Analysis of the market situation, developed in previous trading sessions, shows the intersection of the Tenkan and Kijun lines. Typically, this signal indicates an upcoming increase, but subsequently the price fell below the Tenkan line.
The second most important signal is the change in direction of the Kumo cloud, marked with a vertical purple line. A change in the color of the cloud to lilac indicates a transition of the priority direction of movement to downward.
The current situation
Let’s look at the main components of the indicator and their current values:
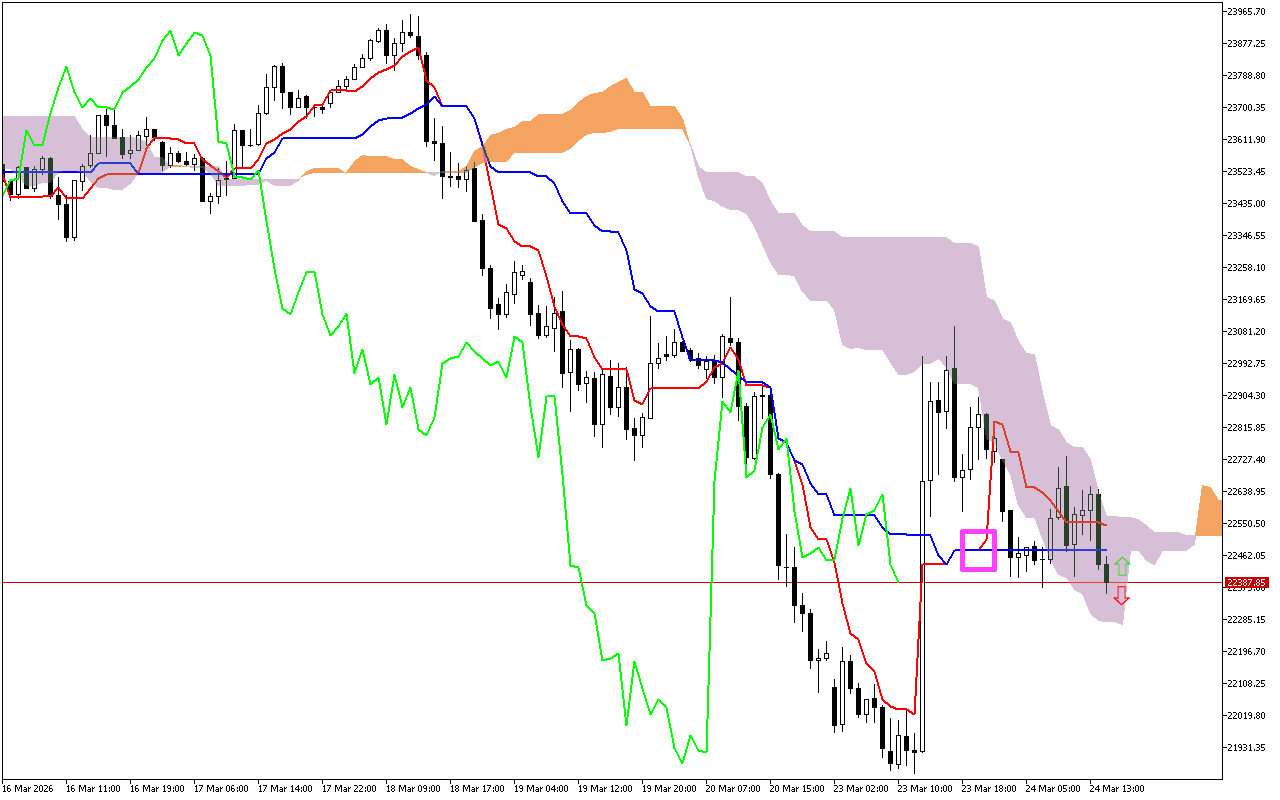
The Tenkan line remains above the Kijun line, but the price has fallen below these lines and is now holding below them.
The Kumo cloud is colored lilac. It indicates the priority of the downward vector of price movement.
The price entered the Kumo cloud, which may indicate a possible trend change or a development a lateral drift phase. The SenkouA and SenkouB lines act as support and resistance. To clarify the market situation, it is worth waiting until the price fixes outside of the cloud.
The Chikou line is now below the current price.
Trading recommendations:
Dynamic support levels are on the Kijun line, near the 22477.07, and the SenkouA line, at the 22283.26 level.
Dynamic resistance levels are on the Tenkan line, around the 22554.65, and the SenkouB line, around the 22636.32.