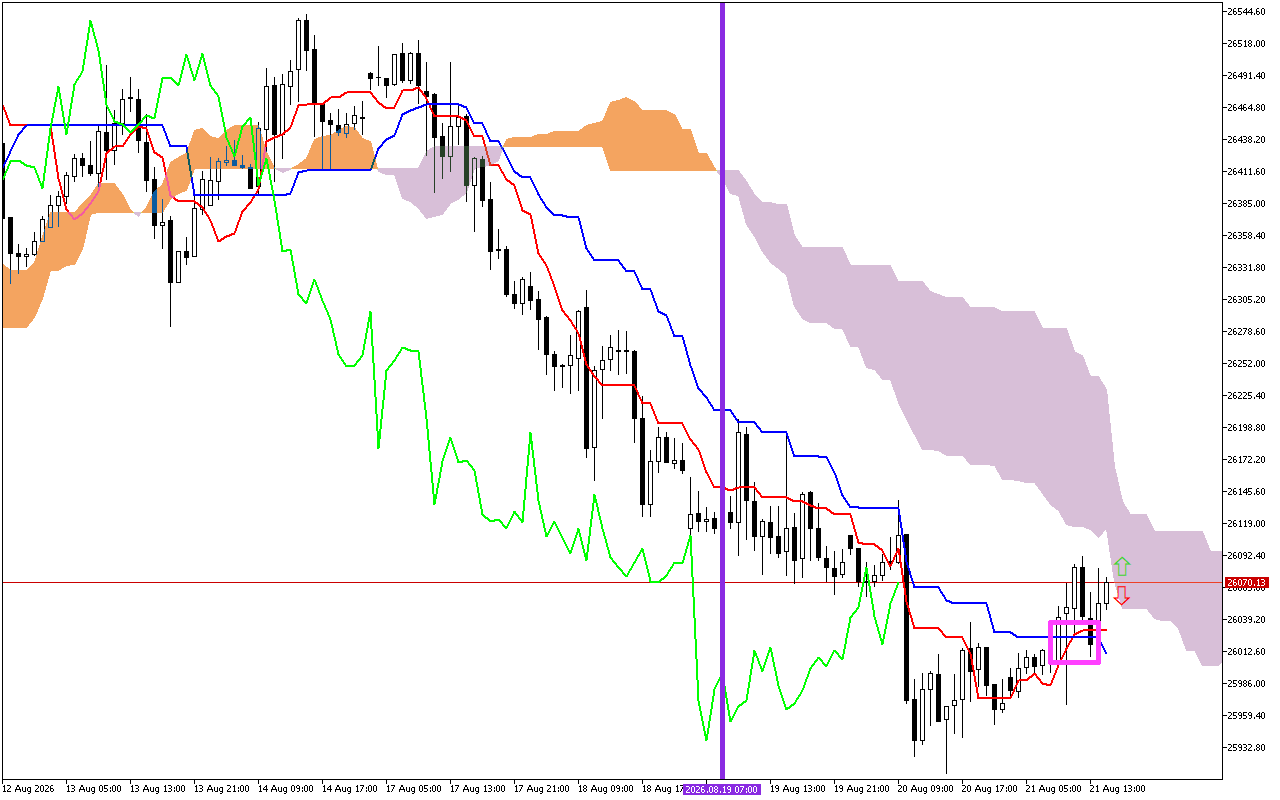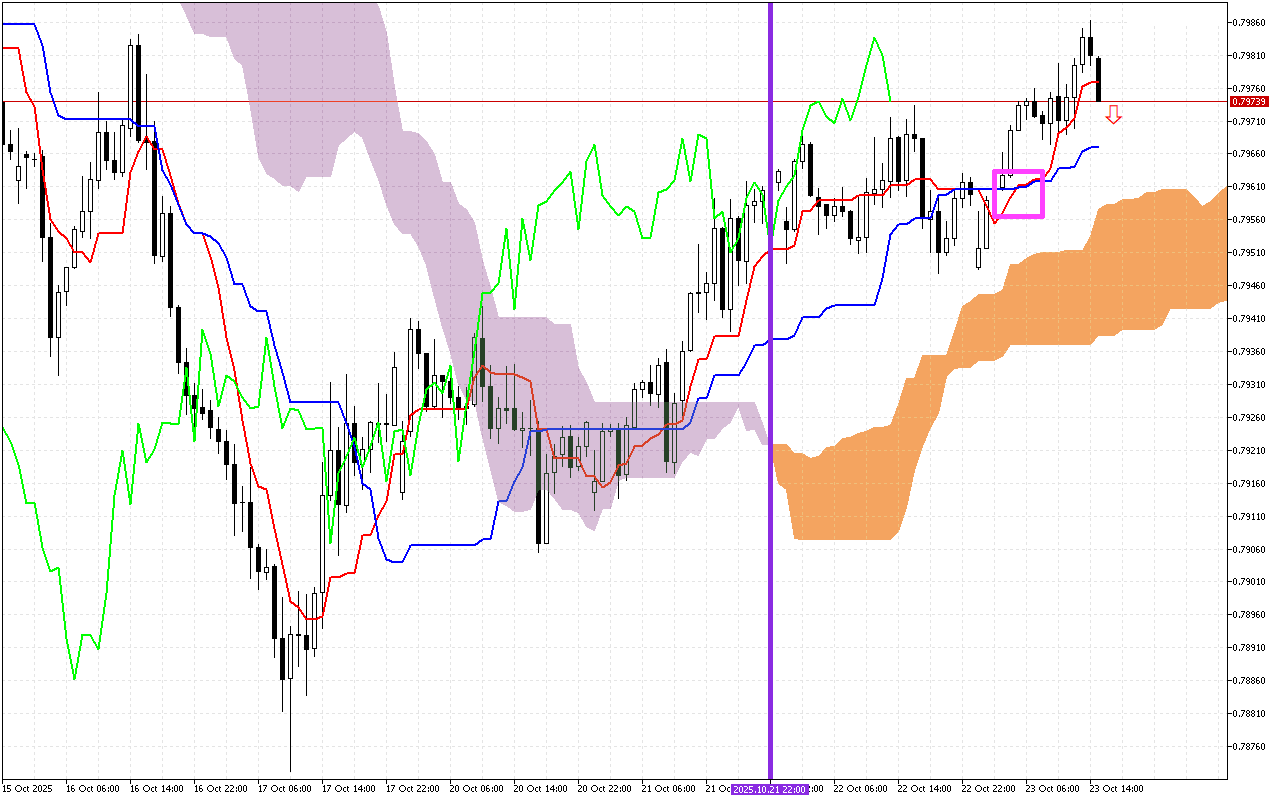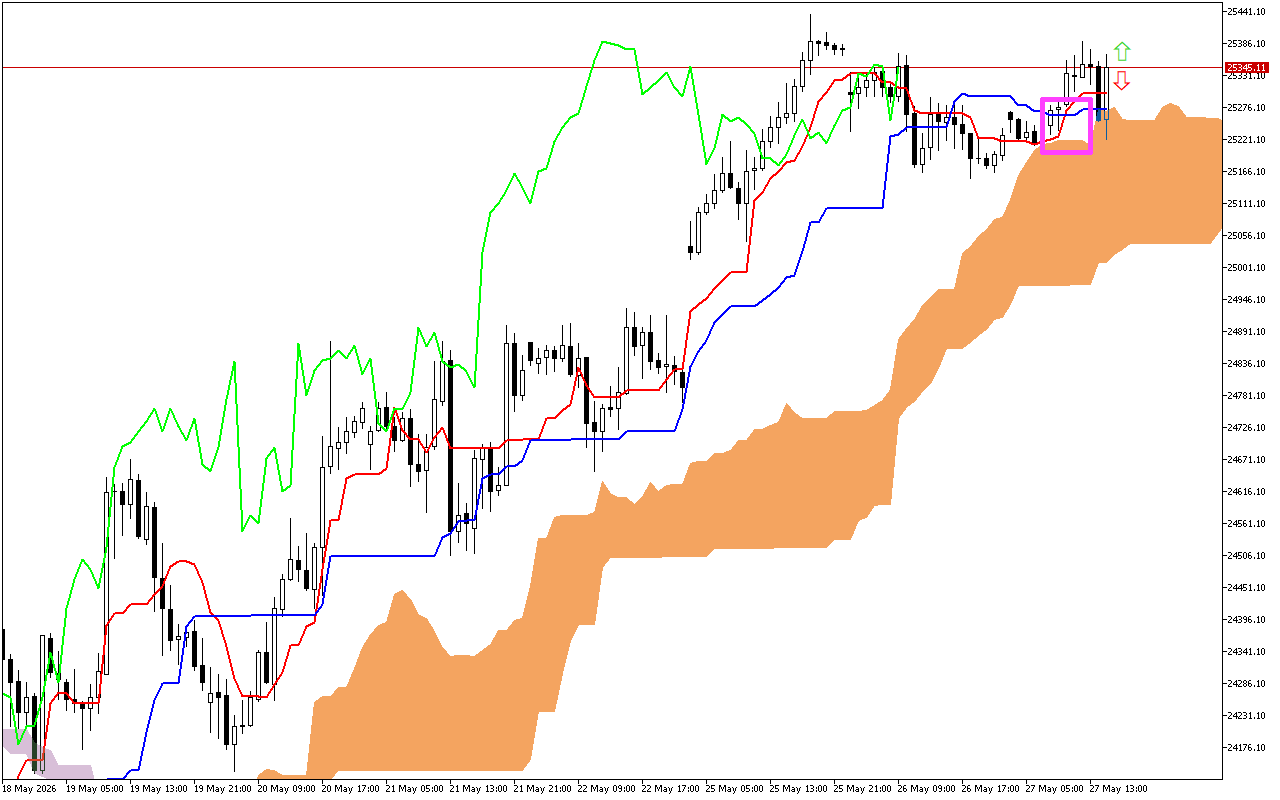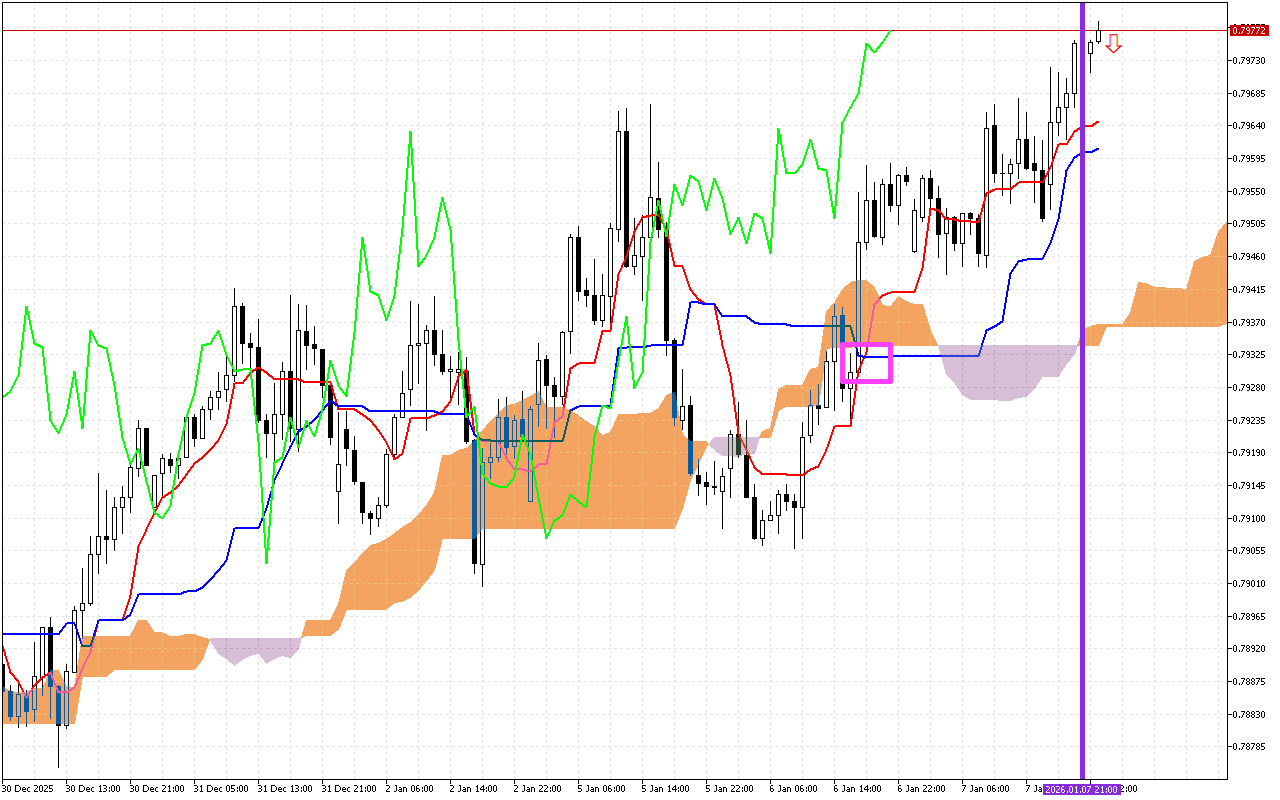
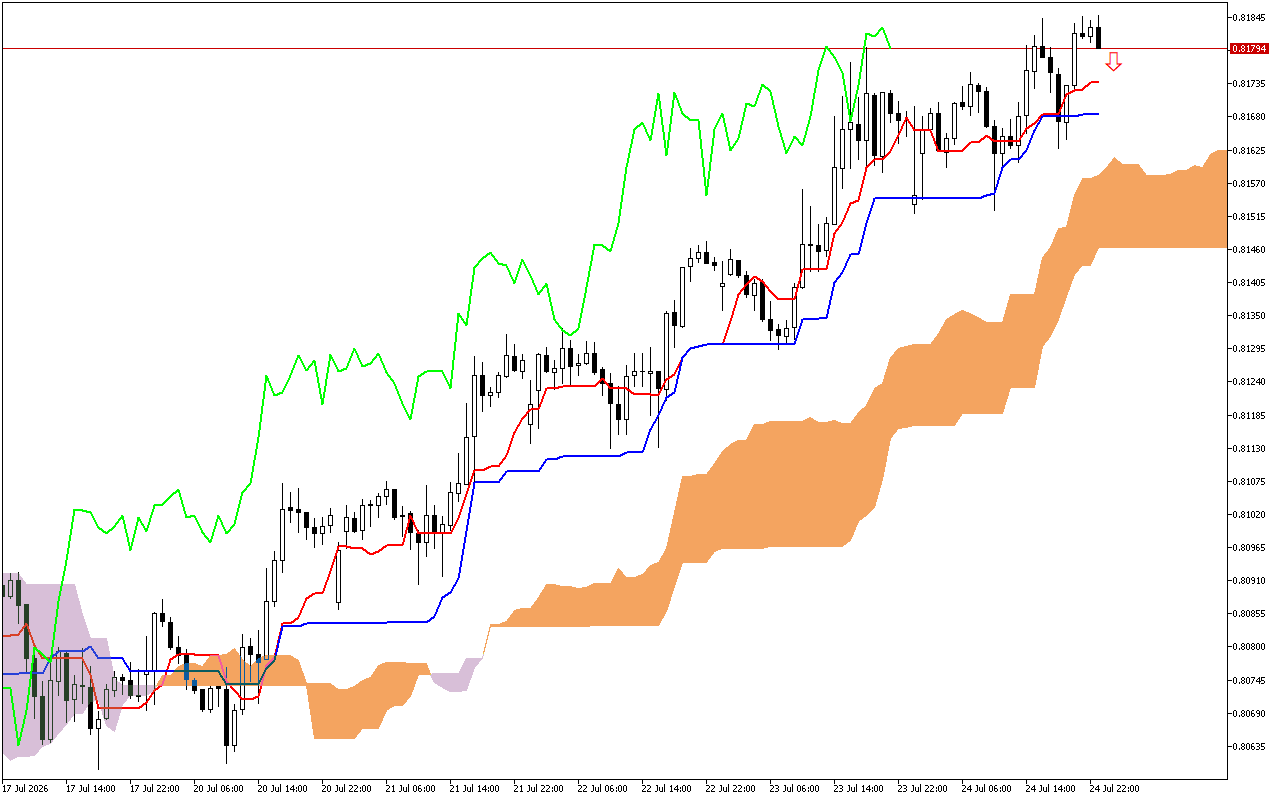
Analysis of past trading sessions provides an unambiguous tendency of the predominance of upward movement in USDCHF. The red Tenkan line is steadily held above the blue Kijun line. Thus, the chart shows no signs of trend weakness, which increases the probability of keeping the upward movement in the near future.
The current situation
Let’s carefully look at the current values of the main components of the Ichimoku indicator to assess the current state of the market:
At the moment a signal of three lines is being observed on the USDCHF chart. Within this signal, the indicator lines are arranged in a certain sequence. Particularly, the price is above the red Tenkan line, the blue Kijun line, and the Kumo cloud. This signal indicates the predominance of an upward movement.
The dynamics of price movement over a longer distance is determined by the Kumo cloud, which is now colored orange. Thus, this signal prioritizes the upward vector of price movement in the future.
Currently, the Kumo cloud lines represent a dynamic support area for price.
Trading recommendations:
Dynamic support levels are seen at the Tenkan line near 0.81737, the Kijun line around 0.81684, the SenkouA line near 0.81577, and the SenkouB line around 0.81434.
Thus, the incoming signals from the Ichimoku indicator support a scenario with a continuation of the upward movement. Against this background, intraday it is worth considering entry points into long positions when the price rolls back to support levels.